Jira dashboard examples
Jira dashboard examples that explain delivery, not just count tickets
Most Jira dashboards show how many issues exist. The examples below show how work actually flows, built from each issue's full status history. For every one: what it shows, why it matters, and the Jira habit that keeps it accurate.
Inside the dashboards
Real TrueAlign 360 captures from a test workspace with synthetic delivery data. These are examples, not promised results.
Cycle time and lead time trend
- What it shows
- Monthly median (p50) and p85 days from first active stage to completion, and from creation to completion.
- Why it matters
- A widening gap between lead and cycle time means work waits in the backlog, not in delivery.
- Jira habit that keeps it accurate
- Map every status to a stage and close work with a Resolution so completion dates are exact.
Flow efficiency
- What it shows
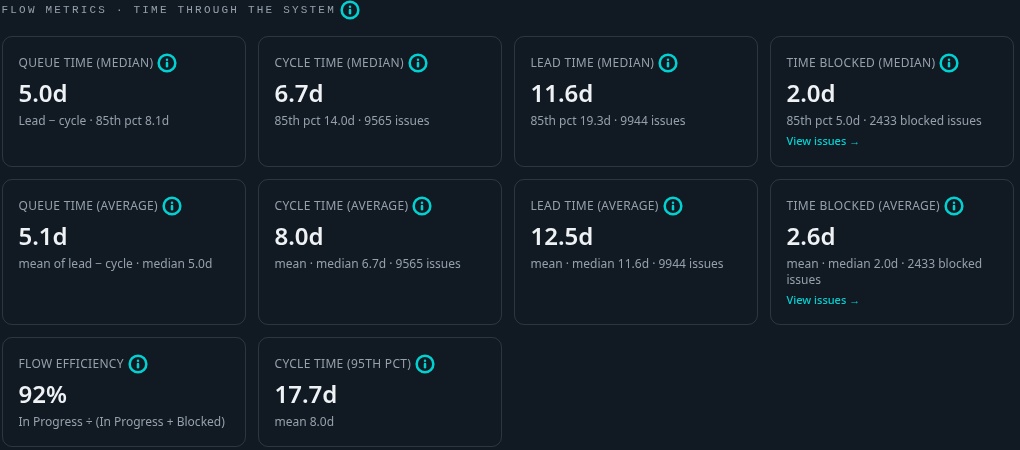
- Share of cycle time spent in active stages versus waiting, review queues and blocked time.
- Why it matters
- Low efficiency points at hand-offs and queues, which adding people rarely fixes.
- Jira habit that keeps it accurate
- Use distinct statuses for waiting (for example Ready for Review) instead of one long In Progress.
Blocked time and dependency drag
- What it shows
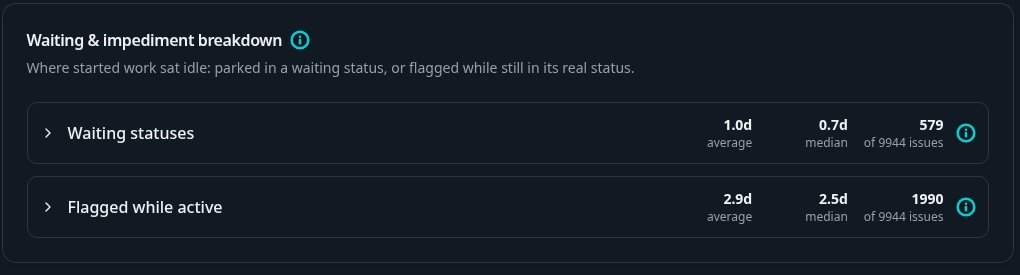
- Time flagged or blocked after work started, plus how long items wait on other projects through 'is blocked by' links.
- Why it matters
- Shows how much delivery time is lost to other teams and how deep blocker chains go.
- Jira habit that keeps it accurate
- Use the Flagged field or a Blocked status, and record dependencies as 'is blocked by' links.
Throughput and cumulative flow
- What it shows
- Items finished per period and how many sit in each stage over time.
- Why it matters
- Growing bands in a cumulative flow chart reveal where work piles up before it becomes late.
- Jira habit that keeps it accurate
- Keep the workflow consistent across projects so stages compare like for like.
Sprint Say/Do
- What it shows
- Items committed at sprint start that were finished in that sprint.
- Why it matters
- A predictability measure leaders can plan around, unaffected by scope added mid-sprint.
- Jira habit that keeps it accurate
- Start sprints with their planned scope and close them on time.
Work in progress ageing
- What it shows
- Open started items compared against your own historical p85 cycle time.
- Why it matters
- Flags work at risk of running late while there is still time to act.
- Jira habit that keeps it accurate
- Move items into an active status the moment work begins.
Escaped defects and quality trends
- What it shows
- Defects found after release versus Bugs found during a sprint, by month.
- Why it matters
- Separates quality issues caught by the team from those customers experienced.
- Jira habit that keeps it accurate
- Use a Defect issue type for post-release problems and Bug for in-sprint ones, or a production label.
Backlog health
- What it shows
- Unstarted items untouched for 180+ days and the share of closed work that was discarded.
- Why it matters
- A rotting backlog hides real priorities and inflates lead time.
- Jira habit that keeps it accurate
- Close stale items with a Won't Do style resolution instead of leaving them open.
Why a native Jira dashboard often can't show these
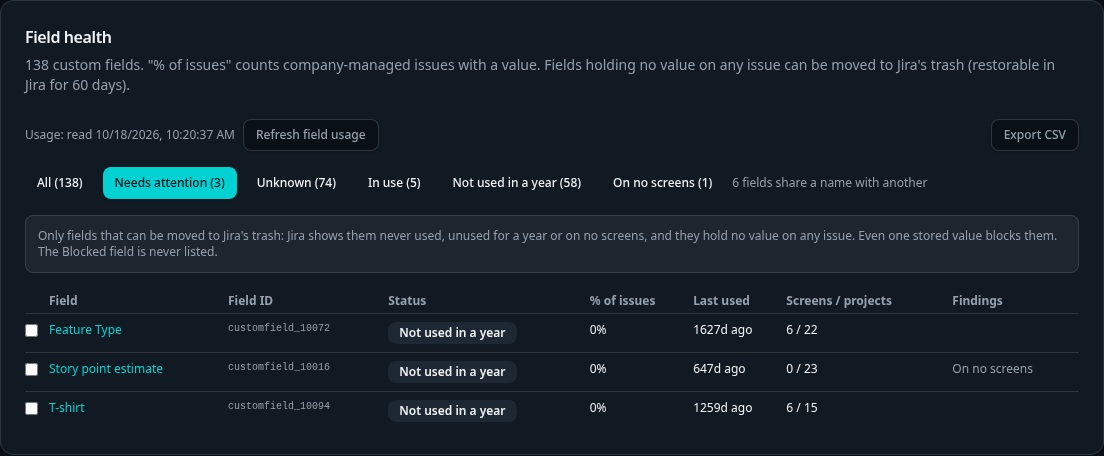
Built-in gadgets read current field values, so they cannot tell how long an item sat in each status, when it was blocked, or whether it was in the sprint when the sprint started. TrueAlign 360 reads the changelog, marks missing evidence as unknown rather than zero, and shows where Jira setup is undermining the numbers.
Start 14-day free trialNo credit card required. Company-managed Jira Cloud projects only.